
Fig. 3.
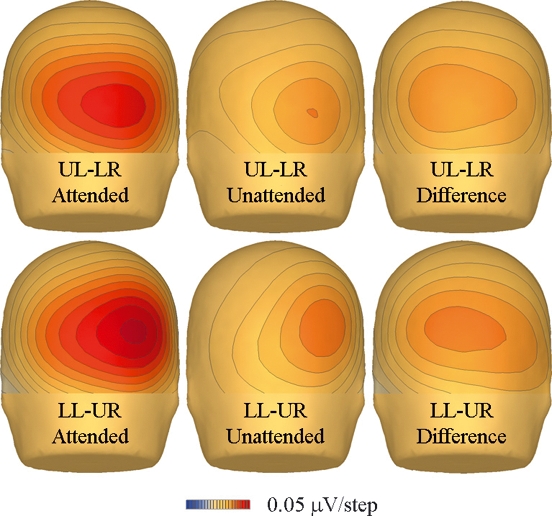
Scalp topographies of the attention effects averaged across the 90–100 ms range (P1), and across all subjects for both the UL–LR (upper panel) and LL–UR (lower panel) stimuli for the attended and unattended cases, and the difference between the attended and unattended cases.