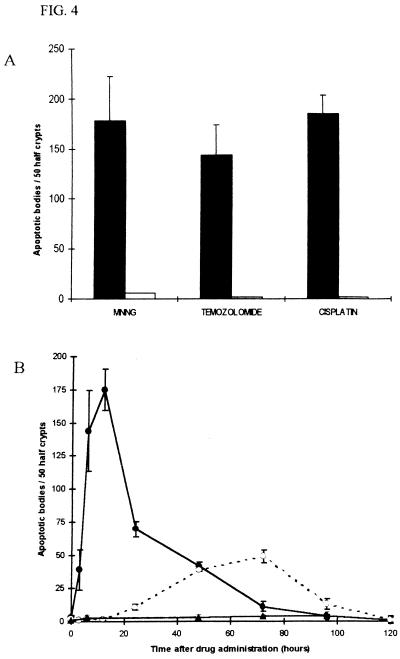
Figure 4.
p53-dependent apoptosis in the small intestine. (A) Mice that were p53 +/+ or −/− were given i.p. injections of MNNG (50 mg/kg), temozolomide (100 mg/kg), or cisplatin (10 mg/kg) at time zero. The mean prevalence of apoptotic bodies at 6 hours is shown. Each bar represents the data from a minimum of three mice. Closed boxes, p53 +/+; open boxes p53 −/−. (B) Time course of the levels of apoptosis in p53 +/+ and −/− mice, and also mice doubly mutant for both Msh2 and p53 after injection of temozolomide (100 mg/kg) at time zero (wild-type data reproduced from Fig. 2B). Each point represents the data from a minimum of three mice. Closed circle symbols, p53 +/+; open circle symbols, p53 −/−; closed triangular symbols, Msh2 −/− and p53 −/−. Error bars represent SEM.

