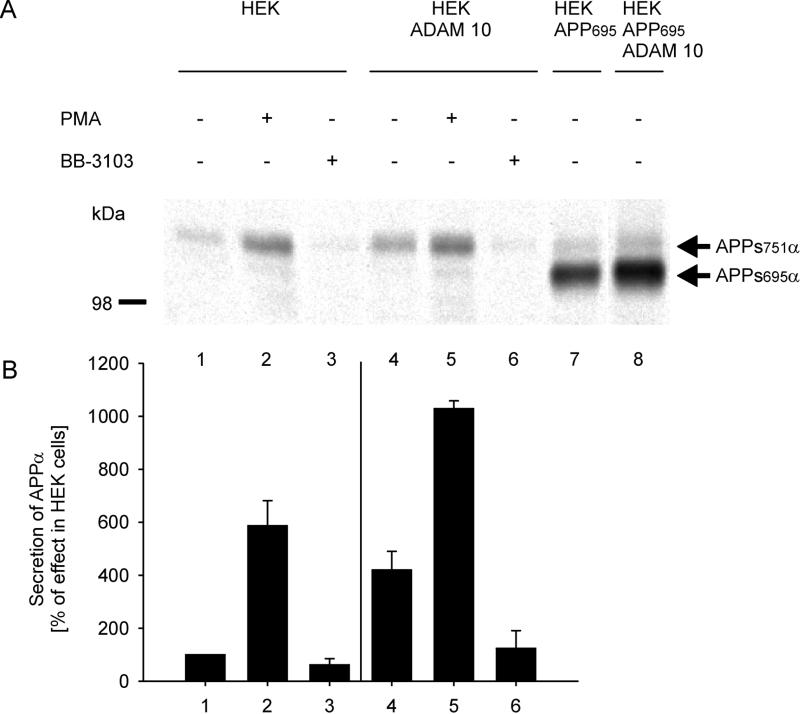
Figure 4.
Secretion of APPsα from HEK and HEK ADAM 10 cells. (A) Cells were incubated in the presence of indicated compound. After 4 hr, the medium was collected, and proteins were precipitated and subjected to immunoblot analysis with antibody 6E10 followed by a 35S-labeled anti-mouse IgG antibody. (B) Quantitative analysis of secreted APPsα. The radioactive bands corresponding to APPsα were quantified with the Bio-Imaging analyzer model BAS-1800. The results are expressed as percentage of secreted APPsα in control HEK cells and are the averages ±SD of at least three experiments.

