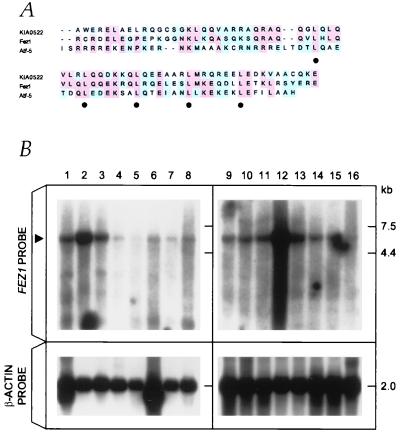
Figure 2.
The predicted FEZ1 amino acid sequence and the expression. (A) Comparison of the predicted amino acid sequences corresponding to the DNA-binding and leucine-zipper regions. Comparison of Fez1 (amino acids 301–369 are depicted) with Atf-5 and KIAA0522 proteins are shown. Identical (red shading) or similar (blue shading) residues among Fez1 and the other two proteins are indicated. Gaps introduced by the fasta program are represented by spaces. Closed circles denote repeated leucine residues. (B) FEZ1 gene expression. Northern blot analysis of normal tissue RNAs. Probes used were the FEZ1 ORF probe (upper) and the control β-actin probe (lower). Poly(A)+ RNA (5 μg) was loaded. The arrowhead on the left indicates the 6.8-kb FEZ1 transcript. RNAs in lanes were from: 1, heart; 2, brain; 3, placenta; 4, lung; 5, liver; 6, skeletal muscle; 7, kidney; 8, pancreas; 9, spleen, 10, thymus; 11, prostate; 12, testes; 13, ovary; 14, small intestine; 15, colon; 16, peripheral blood lymphocyte.

