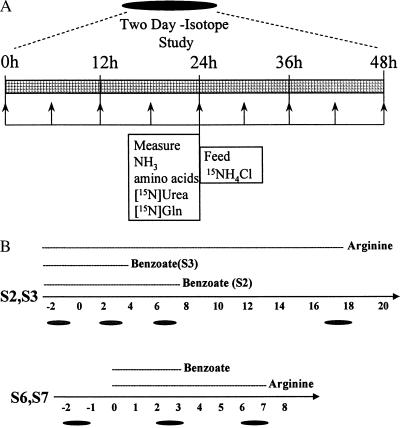
Figure 1.
Schematics of stable-isotope studies. (A) This 2-day stable-isotope study (represented by ovals in B) consists of 15NH4Cl feedings every 6 h, preceded by blood sampling. Metabolic parameters were measured every 6 h and are listed under the time line. (B) Time line (in days) of citrullinemic-calf studies (S2 and S3) and control-calf studies (S6 and S7). The durations of arginine and/or sodium benzoate treatments are shown above the time lines. Ovals represent 2-day stable-isotope studies. For citrullinemic calves (S2 and S3), the days are listed relative to the day of virus infusion (day 0). For control calves (S6 and S7), the days are listed relative to the start of pharmacotherapy with benzoate and arginine (day 0).

