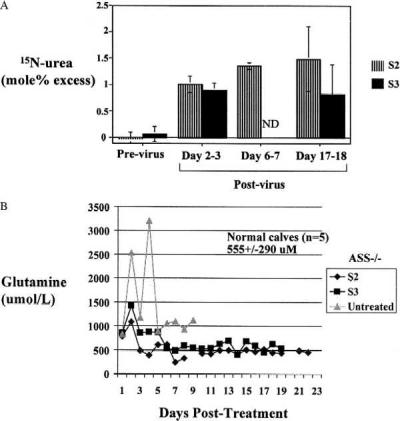
Figure 4.

Efficacy of treatment of citrullinemic calves with AdΔE1CAGASS. (A) Average [15N]urea enrichment in S2 and S3 before vector treatment and at time points after vector treatments (error bars represent SD). The posttreatment (days 6 and 7) study on calf S3 was not done (ND), because the calf experienced gastroenteritis. (B) Time course of plasma glutamine levels in an untreated citrullinemic calf (▴) and in treated S2 (♦) and S3 (■) citrullinemic calves (ASS −/−). Control normal calves have average plasma glutamine levels as shown.
