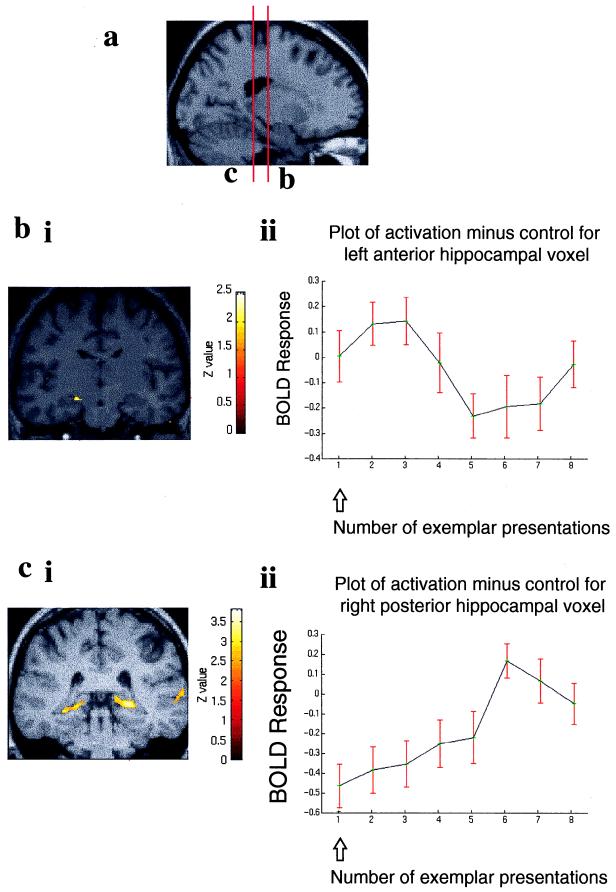
Figure 3.
Dissociation in the anterior–posterior hippocampal axis for exemplar novelty. (a) T1-weighted anatomical sagittal image with red lines indicating the anterior–posterior positions of the coronal sections demonstrated in b and c. (bi) SPM prepared as above showing enhanced left anterior hippocampal activation after the introduction of exemplar novelty followed by deactivation (threshold P < 0.05). The coronal section has been chosen to demonstrate left anterior hippocampal activation (coordinates −18, −16, −14; Z = 2.60). (bii) Graphic representation of activation at this voxel relative to the baseline condition against number of presentations of an exemplar set. The plot shows the BOLD response collapsed across the six exemplar changes and averaged across all subjects. ↑, introduction of novel exemplar set. (ci) SPM (threshold P < 0.01) showing that increasing familiarity with exemplars activates the posterior hippocampus bilaterally. The coronal section has been chosen to demonstrate right posterior hippocampal activation (coordinates 24, −34, −2; Z = 3.63) and also shows the left posterior hippocampal activation (coordinates −22, −38, −6; Z = 3.67). (cii) Graphic representation of activation of the right posterior hippocampal voxel relative to the baseline condition as for b.

