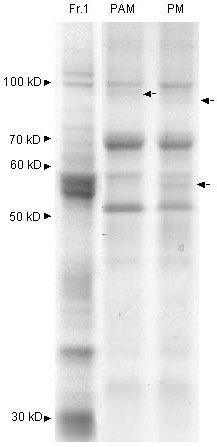
Figure 8.

A comparison of the polypeptide pattern of a PAM fraction with that of plasma membranes and an ER-rich fraction. The polypeptide patterns are shown for an ER-rich membrane fraction (Fr. 1, which is identical to the first fraction of the separated pea microsomes presented in Figure 1), a fraction of plasma membrane associated membranes (PAM; obtained from a plasma membrane fraction) and isolated plasma membrane (PM). The arrows to the right of the lanes point to differences between the PAM and PM fractions. Otherwise as in Fig. 2.
