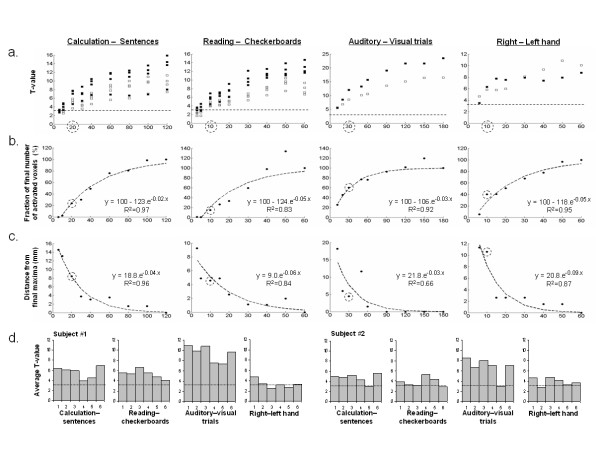
Figure 2.
Impact of the trials number onto the description of individual functional maps. We plotted the evolution of several descriptors of cerebral activation with the number of trials acquired. A dotted circle indicates the value or number of trials obtained after 5 minutes of acquisition. a) Evolution of the t-value with the number of trials performed for 4 peaks selected for 4 contrasts plotted for 2 subjects (black square = subject 1, white square = subject 2). The dotted line represents the t-value corresponding to a voxel p value < 10-3). b) Number of activated voxels in the whole brain (p < 0.001 uncorrected, minimum cluster extent of 10 voxels) relative to the final number of voxels activated after 6 blocks (averaged over subjects). The dotted curve represents the fitted logarithmic curve. c) Evolution of the distance (mm) of selected peaks from their respective final location after 6 blocks (averaged over subjects). The dotted curve represents the fitted logarithmic curve. d) For each subject and each contrast the mean t-value of the 500 most significant voxels for each of the 6 blocks is plotted. The line represents t-value corresponding to a voxel p value < 10-3.

