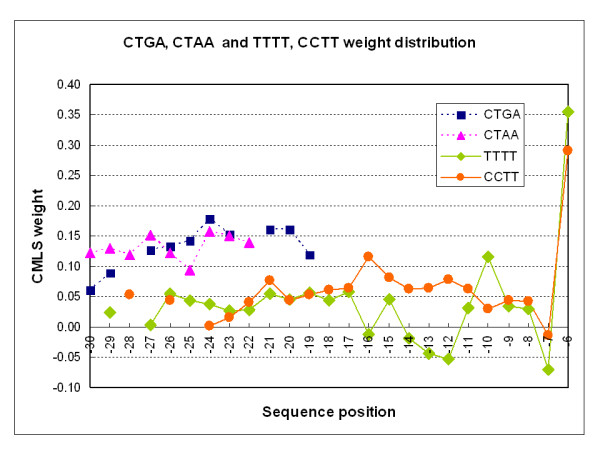
Figure 2.

Weight distribution comparison for pairs of tetramers CTGA, CTAA and TTTT, CCTT. The distribution of CMLS weights for four tetramers from A-3mer1 [-60,-5] is shown graphically. Note that the distributions of scores for CTGA and CTAA are similar and sharply focused around the peak that would place the branch A at position -24. Note that the distributions of TTTT and CCTT corresponds to the well-known pyrimidine tract with the additional information that C is preferred to T at positions -15 through -11, where a peak of scores for CCTT coincides with a group of negative values for TTTT. There are no occurrences of these four hexamers in this feature set upstream of the region shown.
