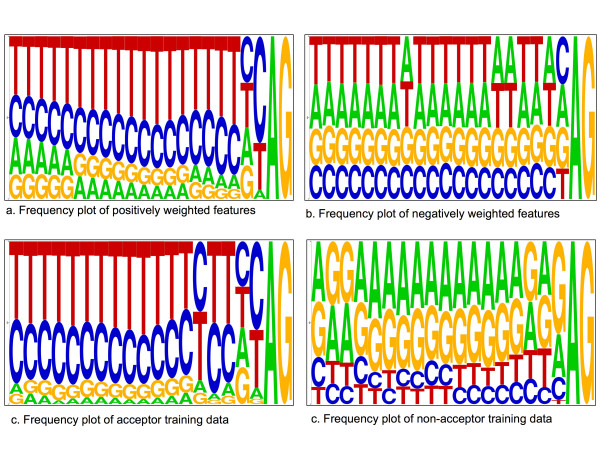
Figure 3.
The acceptor splice-site (pyrimidine-tract) interval. Frequency plot sequence logos for the positively and negatively weighted features in the pyrimidine-tract interval, A-5mer1 [-20,-1], (Figure 3a and Figure 3b), compared with frequency distribution of the training acceptor and non-acceptor sequences in the same interval (Figure 3c and Figure 3d). The positive features frequency plot corresponds to the acceptor splice-site consensus, which is also illustrated with the true acceptor sequences frequency plot. The negative features frequency plot reveals an AG-rich element.

