Figure 1.
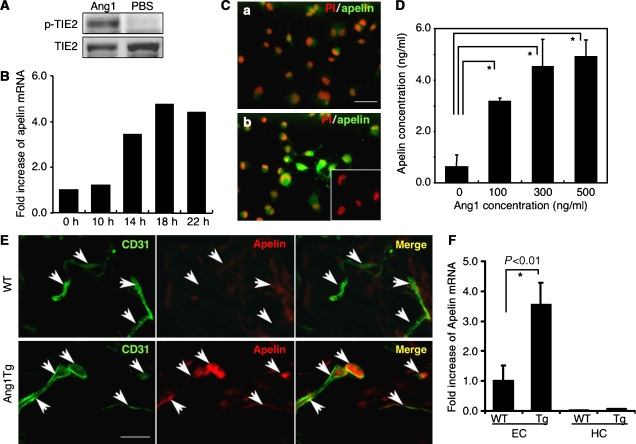
Ang1 stimulation induces apelin expression in ECs in vitro and in vivo. (A) Tie2 phosphorylation on HUVECs by Ang1 in our system. HUVECs, serum-starved for 2 h, were either treated or not treated with 500 ng/ml Ang1 for 10 min. Phosphorylation was studied by immunoblotting using phosphospecific antibody (p-Tie2). (B) Quantitative real-time RT–PCR analysis of apelin mRNA in HUVECs. Total RNA was extracted from HUVECs that had been stimulated with Ang1 for 0–22 h. Results are shown as fold increase in comparison with basal levels of HUVECs (0 h). (C) Immunocytochemical analysis of apelin expression in HUVECs, non-stimulated (a) and stimulated (b) by Ang1 (500 ng/ml) for 20 h. Cells were stained with anti-apelin mAb (green). The inset in (b) shows HUVECs stained with secondary antibody as a negative control. Nuclei were stained with propidium iodide (PI; red). Scale bar indicates 50 μm. (D) Quantitative enzyme immunoassay of apelin production from HUVECs stimulated by various doses of Ang1. *P<0.001 (n=3). (E) Immunochemical detection of apelin peptide in the dermis. Sections of skin from WT and Ang1Tg neonatal mice were stained with anti-CD31 (green) and anti-apelin (red) mAb. Arrows indicate CD31+ blood vessels. Scale bar indicates 30 μm. (F) Quantitative real-time RT–PCR analysis of apelin mRNA in ECs and hematopoietic cells (HCs) of Ang1Tg mice. RNA was prepared from sorted CD31+CD45− ECs or CD31−CD45+ HCs from the dermis of WT or Ang1Tg neonatal mouse skin. *P<0.01 (n=3).

