
FIGURE 1.
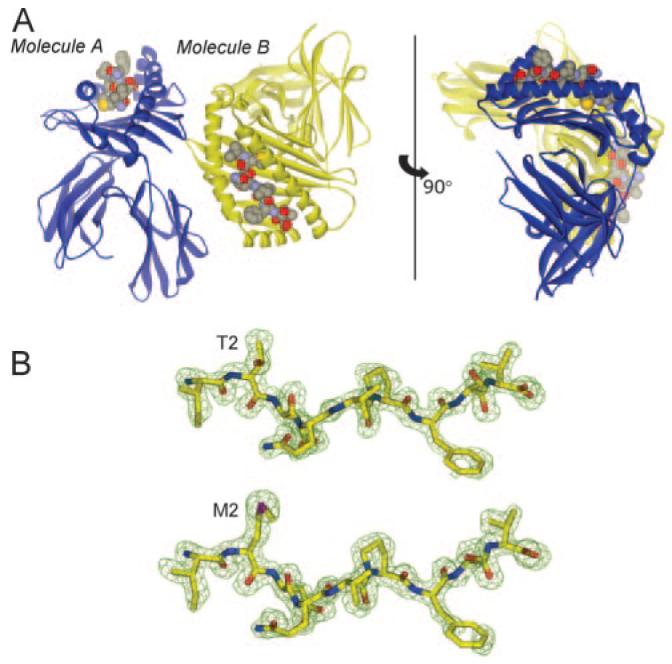
Overview of the gp100209/HLA-A2 and gp100209–2M/HLA-A2 crystal structures. A, Orientation of the two molecules observed in the two asymmetric units. Molecule A is blue and molecule B is yellow. This image shows the T2M-modified structure, but the overall structure with the native peptide is identical. B, 2Fo-Fc electron density maps contoured at 1 σ for the peptides from the A molecules. Native peptide is on top, the T2M variant is on the bottom.