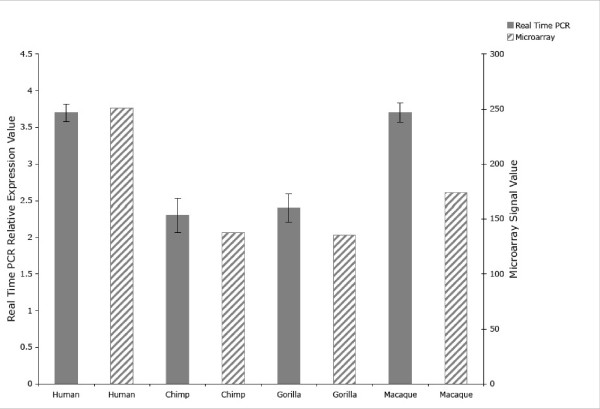
Figure 3.
COX5A Expression levels as determined by quantitative RT-PCR (solid bars) and microarray signal values (hatched bars). qRT-PCR expression levels are expressed in relative terms, with samples compared to a calibrator amplified from human reference total RNA and represented as species means (± SEM). Samples were tested in triplicate, providing 9 total measurements for human and macaque and three total measurements for chimpanzee and gorilla. Microarray expression levels were as determined in [24].

