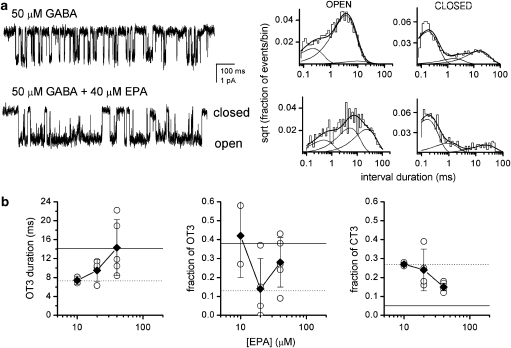
Figure 3.
The effect of eupalmerin acetate (EPA) on single-channel currents from HEK cells expressing α1β2γ2L receptors. (a) Sample clusters elicited by 50 μM GABA in the absence (top trace) and presence of 40 μM EPA (bottom trace). Open- and closed-time histograms from the respective patches are given next to the current traces. For 50 μM GABA, the open times were 0.21 ms (24%), 3.4 ms (72%) and 9.3 ms (4%), and the closed times were 0.16 ms (64%), 1.6 ms (11%) and 15.2 ms (25%). For GABA+40 μM EPA, the open times were 0.45 ms (21%), 4.8 ms (41%) and 22.2 ms (38%), and the closed times were 0.15 ms (66%), 0.8 ms (18%) and 21.3 ms (15%). A summary of averaged data for all patches under these conditions is given in Table 1. (b) Concentration–effect relationships for the duration of OT3, fraction of OT3 and fraction of CT3. The open circles give values from individual patches, solid diamonds show mean values±s.d. from all patches. The dotted line gives the mean value for the parameters in the presence of 50 μM GABA in the absence of modulators. The solid horizontal line gives the mean value for the parameters in the presence of 50 μM GABA and 1 μM allopregnanolone (Li et al., 2007a).

