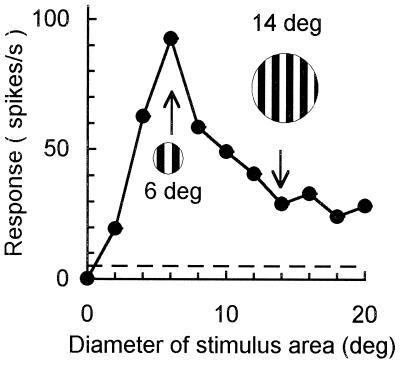
Figure 1.
Area summation curve showing the inhibitory surround effect of an area 18 cell. A circular grating patch located at the center of the CRF was systematically varied in size. With increasing stimulus size, a maximum response was reached at a point (arrow on the left) indicating the limit of the CRF. Then the response decreased with further increasing size. The point at which the response decreased to an asymptote (arrow on the right) indicates the extent of the inhibitory surround. Size of the small and large gratings (Insets) represents the relative size of the CRF and the inhibitory surround, respectively. Responses were accumulated for 10 cycles, and SEs were calculated over five repetitions. Bars = ±1 SE.

