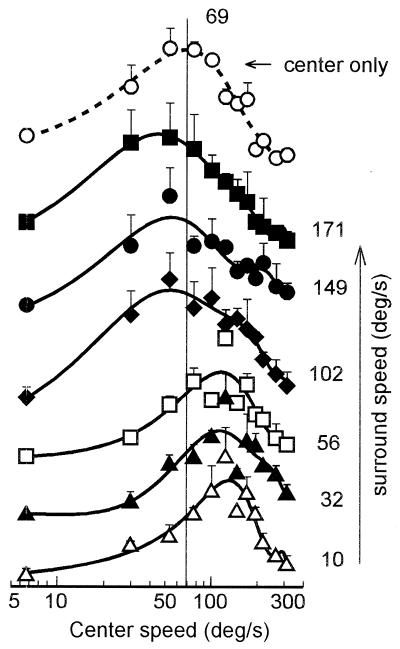
Figure 3.
Speed tuning curves of an area 18 cell measured in the presence of a surround grating drifted at systematically varying speeds. Numerals on the right represent the surround speed (in °/s) used to obtain each curve. The dashed curve on the top was obtained with the center-only grating; vertical line indicates location of the optimal speed (69°/s) tested under this condition. Each point is the mean of five trials. The curves are the best fitting polynomial functions of the sixth order. Bars = 1 SE; in some cases, the bar is too small to be seen.

