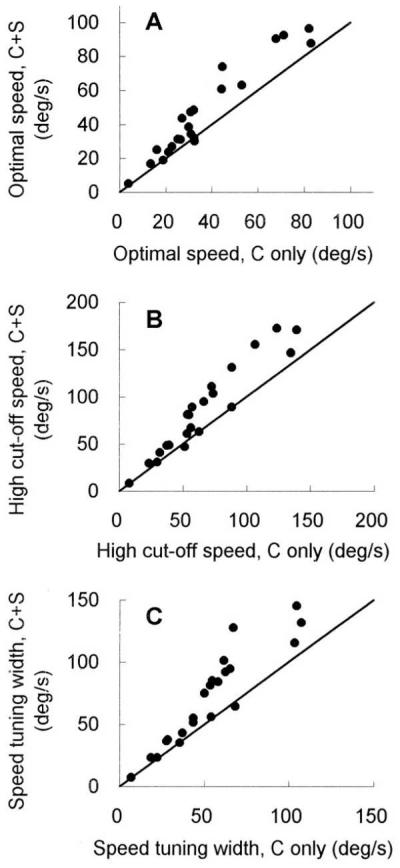
Figure 4.

The summary plots of 22 cells, showing the alterations in speed tuning properties caused by a surround grating moving at a slower speed relative to the optimal speed. (A) The optimal speed measured with the center-only grating (abscissa) is plotted against the optimal speed of the same cell tested in the presence of a surround grating (ordinate) drifted at a relatively lower speed (the low cut-off speed for each cell). (B and C) The same comparison for high cut-off speed (B) and for tuning bandwidth (C). In the axis labels, C represents the center-only condition, and C+S represents the center-plus-surround condition.
