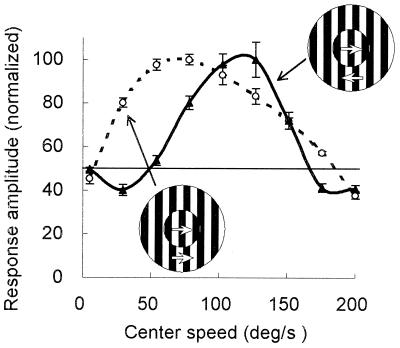
Figure 6.
Comparison of the speed tuning of an area 18 cell tested with surround gratings moving at the same speed but in two opposite directions. The dotted line represents the speed tuning tested when the surround grating moved in the preferred direction; the solid line, the speed tuning obtained when the surround grating moved in the opposite direction. The drifting speed of the surround gratings was set at the optimal speed (92.6°/s) in both cases.

