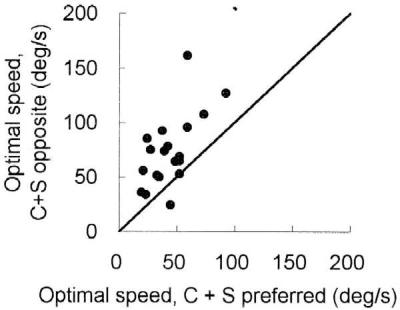
Figure 7.

Comparison of the speed tuning of 19 cells tested with surround grating moving in the preferred and the opposite directions. For each of these cells, the optimal speed tested with the preferred direction of surround movement is plotted against that measured with the surround grating moving in the opposite direction. Speed for the preferred and the opposite movement was set at the optimal speed of each of the individual cells.
