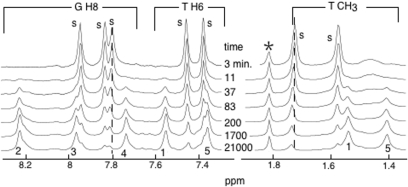
Figure 1.
Aromatic and methyl proton region of spectra recorded during the association kinetics of TG3T. The spectra were collected at different times right after melting of the oligonucleotide. The NMR peaks of the monomer are labeled ‘s’ and those of the quadruplex are labeled by the residue number according to Jin et al. (8). The line labeled by a star is that of acetate, a marker used to control the solution pH. The aromatic and methyl proton regions of the NMR spectrum show several well-resolved lines providing markers to measure the fraction of each species as a function of the time. The small chemical shifts observed for several NMR peaks of the monomer are indicated by dotted lines. They reflect a fast exchange situation between the monomer and an intermediate species, presumably (TG3T)2 (see text). Solution conditions: (TG3T) = 1.5 mM, T = 0°C, [K+] = 10 mM.

