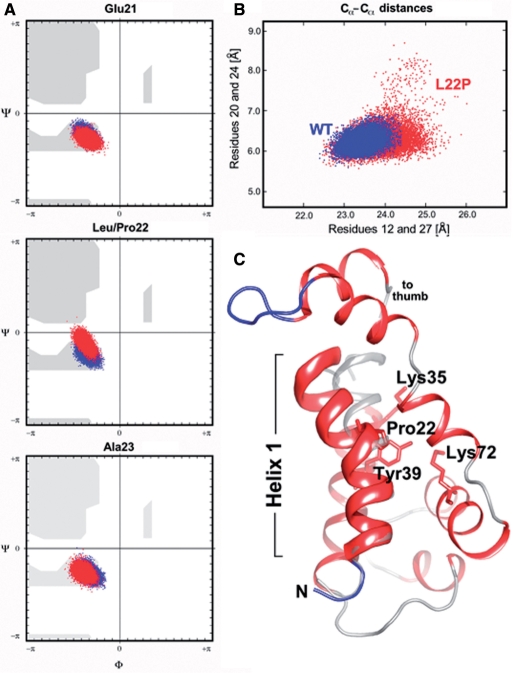
Figure 7.
Analysis of MD simulations. (A) Changes in Ramachandran backbone angles for residues Glu21, Leu/Pro22, Ala23 along the 20 ns trajectory. The backbone torsion angles for the wild-type pol β; are shown in blue and the phi/psi angles of the Pro22 mutant are depicted in red. Note the deviations in backbone torsion angles in the middle panel (site of mutation; Leu22, blue dots; Pro22, red dots). (B) Scatterplot of inter-residue distances (20–24 and 21–27) The distortion of helix 1 during the dynamics simulation has been visualized by plotting the distances between residues 20–24 and 21–27 (highlighted by the dotted line in ribbon diagram below). Residues 20, 21, 24 and 27 lie in the same plane as the bend in helix 1. (C) Cartoon drawing of the 8 K domain of L22P at 15.9 ns showing a significant bending of helix 1 at residue 22. Helix 1 is highlighted as a thickribbon, the remainder of the 8 K domain is depicted as a thin ribbon. The N-terminal helix of the wild-type pol β; crystal structure (PDB code 1bpy) is overlaid in gray (semi-transparent rendering). Note that helix 1 in wild-type polβ is nearly perfectly straight.

