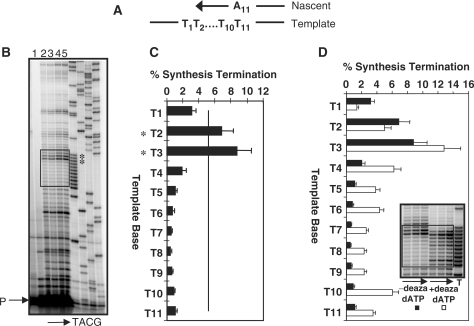
Figure 2.
Polymerase κ termination within the T11 microsatellite. (A). Cartoon depicting DNA synthesis through the allele. (B). Representative phosphorimager scan of primer extension reaction products. Reactions were incubated at pH 7.0 and 30°C. Arrow indicates reaction time from 5 to 60 min. P, unextended primer. Lane 1, no polymerase control. Lanes 2–5, products of 5, 15, 30 and 60 min reactions. The 30 min reaction gave a total percent extension of 16.5%. Boxed region is the microsatellite. (C) Quantitation (30 min) for each template position in the microsatellite (mean of seven reactions). The continuous line represents the value of the percent synthesis termination that is 1 SD above the mean of all values within a given microsatellite. Asterisks indicate pause sites. (D) Deaza-dATP effect on termination. Quantitation of 30 min reactions without deaza-dATP (filled bars) or with deaza-dATP (open bars, three independent reactions). Inset: representative scan of primer extension products, with arrows indicating reaction time (5–30 min) and a box to indicate the beginning and end of the microsatellite sequence.

