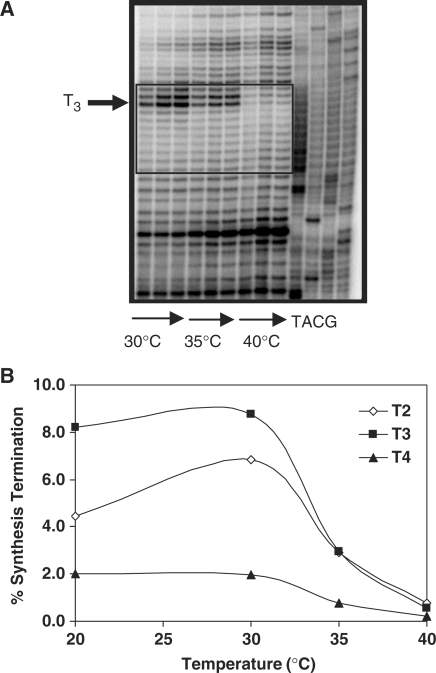
Figure 4.
Effect of reaction temperature on polymerase κ termination at the T11 allele. (A) Representative phosphorimager scan of primer extension reaction products. Arrows indicate reaction time (5–30 min). Boxed area shows the beginning and end of the microsatellite sequence. (B) Variation of percent synthesis termination with temperature for nucleotides T2, T3 and T4. Each point represents mean of two independent experiments (30 min).

