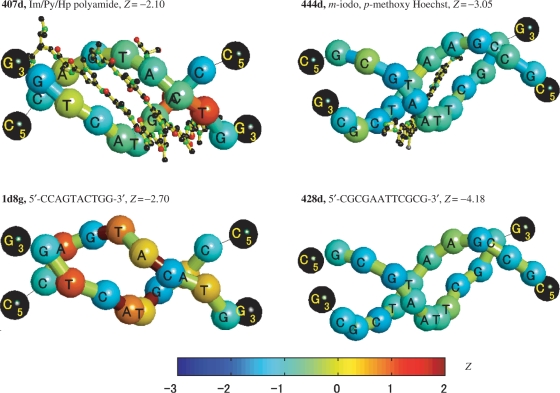
Figure 3.
‘Worm’ graph representations of drug-DNA crystal structures (top) and the corresponding free B-DNA crystal structures (bottom). The color codifies the Z-score value of the energy in each dinucleotide step (the blue color indicates high specificity and the red, low). The tube passes across the backbone formed by the C1 carbons of each nucleotide. The terminal bases are represented with black spheres and the terminal steps, for which the Z-scores are not calculated, with thin black lines. The subindices 5 and 3 stand for terminals 5′ and 3′ of the DNA sequences. The ligands and the heteroatoms are shown as ball and stick models. The color bar in the bottom represents the color codification of the Z-scores of the conformational energies.

