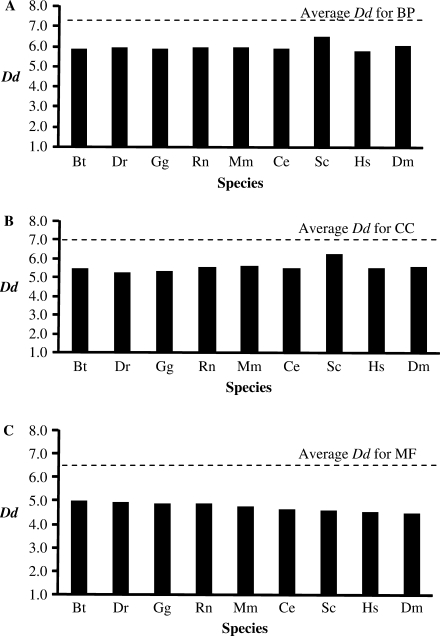
Figure 1.
The DAG depth (Dd) for each Gene Ontology. The overall average Dd (dashed line) was determined for all GO terms in each ontology (as at 05/052007). GO term Dds were compared to mean Dd of each species for (A) Biological Process (BP), (B) Cellular Component (CC) and (C) Molecular Function (MF). The species represented are B. taurus (Bt), D. renio (Dr), G. gallus (Gg), R. norvegicus (Rn), M. musculus (Mm), C. elegans (Ce), S. cerevisiae (Sc), H. sapiens (Hs) and D. melanogaster (Dm).

