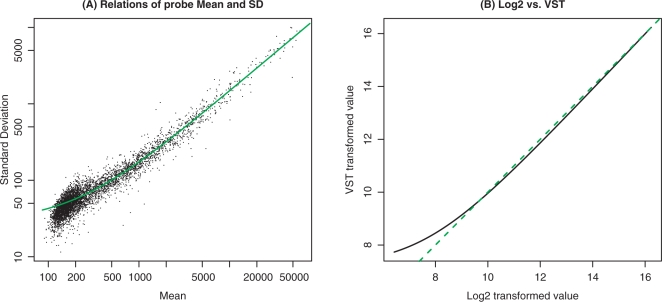
Figure 1.
(A) The relations between standard deviation and mean of bead-level replicates of each probe in one representative microarray (titration ratio of 100:0 of the Barnes data set). The green line represents a linear fitting. (B) Log2 versus VST transformed values. The green line in Figure A is the fitted curve; the green dotted line in Figure B represents Log2 = VST. The plots are based on the first sample (titration ratio of 100:0) of the Barnes data set.

