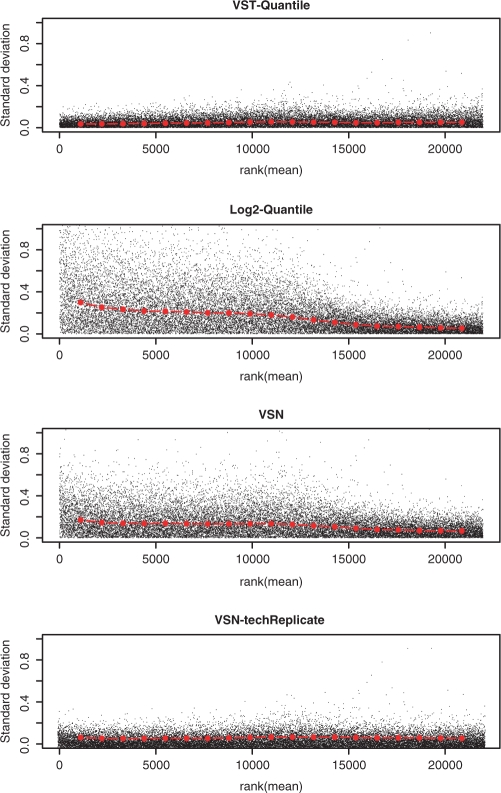
Figure 3.
Rank of mean and standard deviation relations of the technical replicate microarrays after preprocessing. The red dots depict the running median estimator (window-width 10%). Plotted are two 100:0 (blood:placenta) replicates in the Barnes data set, which are separately located at two HumanRef-8 BeadChips. (A) VST- transformed and quantile-normalized; (B) log2-transformed and quantile-normalized; (C) Regular VSN-processed. (D) VSN-techReplicate method performed VSN only using the pair of technical replicates. Note: for Figure A–C, all six pairs of samples were preprocessed together, although only the replicates of the 100:0 group were plotted.

