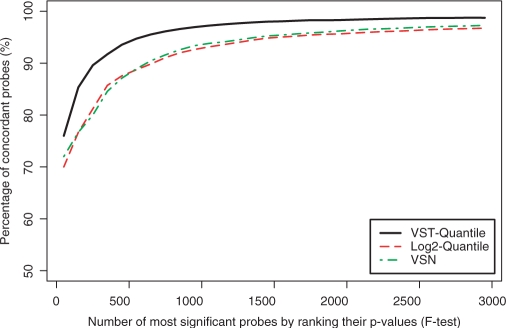
Figure 6.
The percentage of concordant probes among the top probes by ranking the F-test P-values. The concordant probes are defined as those with correlation coefficients between the gene expression profile (measured by probe intensities) and the titration profile larger than 0.8. Note that the F-test P-value of the 3000th probe is 0.00019, 0.00022 and 0.00023 (VST-quantile, log2-quantile and VSN, respectively).

