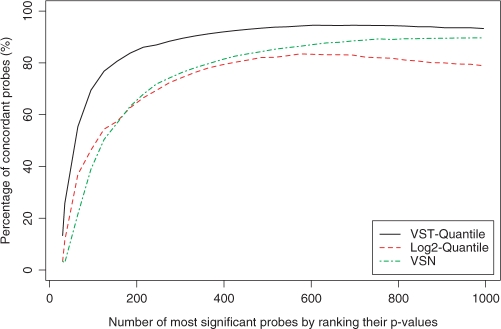
Figure 7.
The percentage of concordant probes among the top probes by ranking the t-test p-values estimated by ‘limma’ (16). The concordant probes are defined as those with correlation coefficients between the gene expression profile (measured by probe intensities) and the titration profile larger than 0.8. Note that the P-value of the 1000th probe is 0.0013, 0.0079 and 0.0040 (VST-quantile, log2-quantile, and VSN respectively).

