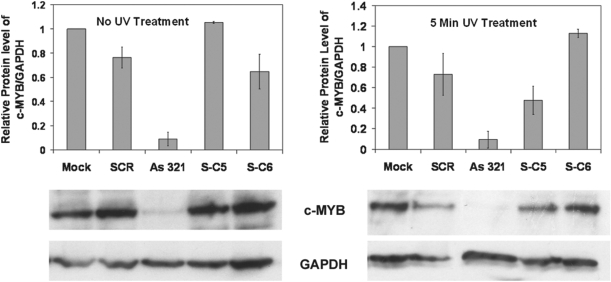
Figure 7.
c-MYB protein analysis by western blot performed on nucleofected K562 cells, either in the dark or treated with UV light for 5 min. Graph shows relative protein levels of c-MYB to GAPDH as quantified from western blots using ImageQuant. Mock cells were nucleofected with buffer in the absence of DNA, and other data were normalized to the Mock data, for which the ratio of gel intensities (c-MYB/GAPDH) was set to 1. Protein analysis was done 24 h post-nucleofection, with data from two independent trials. Error bars show deviation from the average.

