
Figure 4.
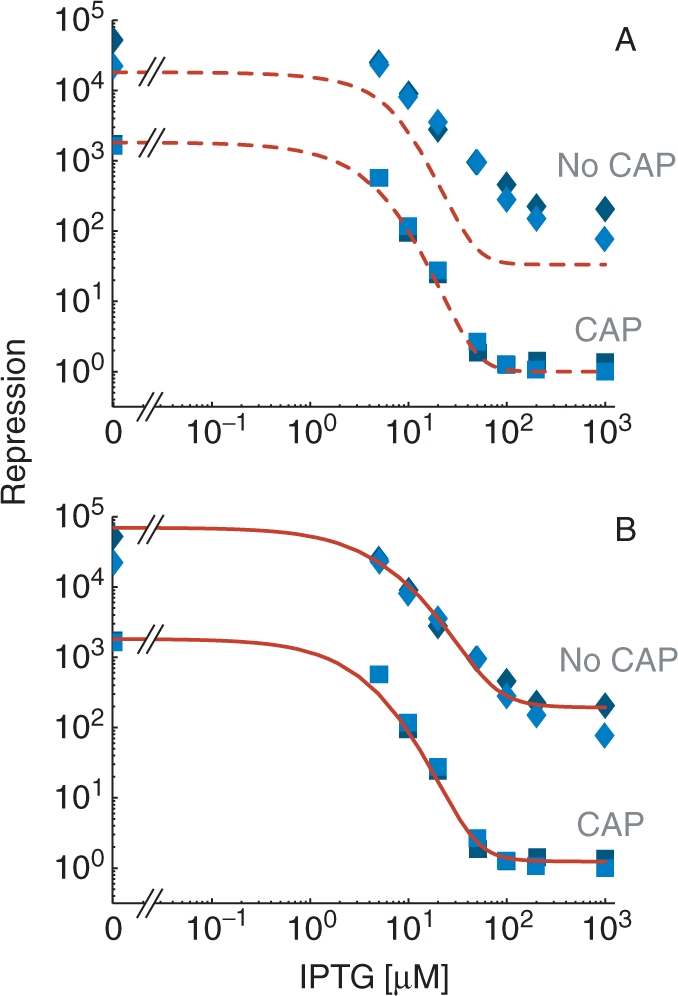
Induction curves of the lac operon for cellular conditions with and without active CAP. (A) The repression level in the presence of active CAP (lower curves labeled ‘CAP’) was obtained as a function of the concentration of the inducer IPTG for the model given by ΔG(s), τ(s), and  (dashed red lines) and compared with the experimental data from Ref. (17) (blue squares). The values of the parameters are the same as in Figure 2, with additional parameters KI = 6.9μM and nT = 15 nM. In the absence of active CAP (upper curves, labeled ‘No CAP’), the model (dashed red lines) does not accurately reproduce the experimental data from Ref. (17) (blue diamonds). We consider that without active CAP, in addition to a reduced transcription
  , the formation of the O1-O3 loop is 0.9 kcal/mol more costly (c'L13 = 22.95 kcal/mol) than with CAP. (B) The excellent agreement with induction experiments in the absence of active CAP is recovered when the model is generalized to include an arbitrary number of repressor molecules per cell through the expressions ΔGF(s), τF(s), n, nd, and ni, with same values of the parameters as in panel A, with the additional parameter r = 2.8 kcal/mol and 200 repressors per cell (nT = 300 nM) (upper continuous red line). In the presence of active CAP, the generalized model (lower continuous red line) recovers the results in panel A for low number of repressors (nT = 15 nM).