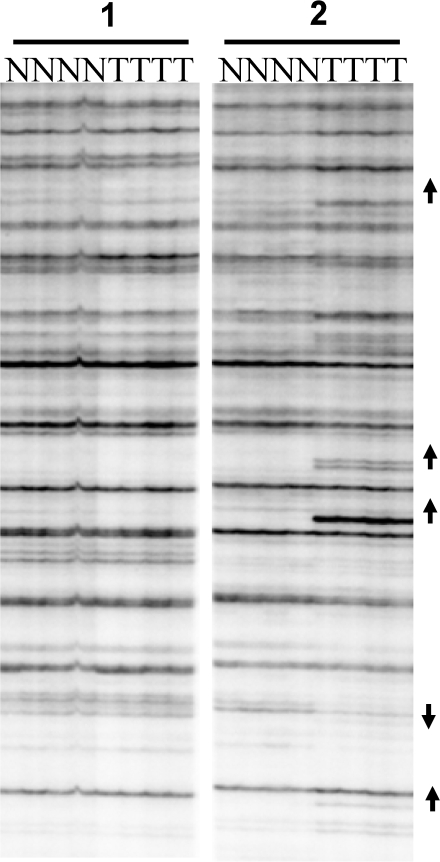
Figure 2.
AUMA of normal (N)–tumor (T) pairs of two different patients performed using primer BAu-TT. A highly reproducible band patterning is observed among the four replicates. Representative bands showing gains (hypomethylations) and losses (hypermethylations) are marked with up and down arrowheads, respectively.

