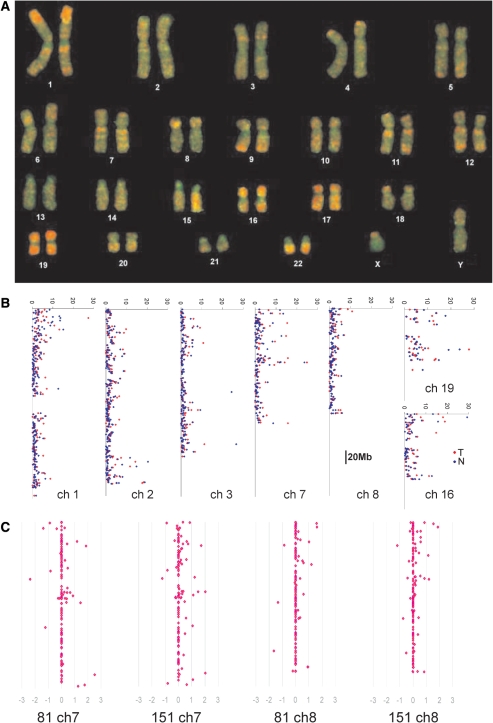
Figure 5.
(A) Chromosomal origin of AUMA products. A competitive hybridization of AUMA product obtained from normal tissue DNA (red) and genomic DNA (green) to metaphase chromosomes was performed. AUMA products showed an unequal distribution along chromosomes, displaying highest densities at most telomeric regions and some interstitial bands. Chromosomes 16, 17 and 19 yielded the highest AUMA density. (B) Intensity distribution of AUMA products hybridized to BAC arrays in selected chromosomes. The average intensity (X-axis) of the two normal (blue) and tumor samples analyzed (red) for each BAC is shown. BACs are arranged along the Y-axis according to its position in the chromosome. (C) Differential methylation profiles determined by competitive hybridization of AUMA products from normal and tumor tissue to BAC arrays. Illustrative examples are shown for chromosomes 7 and 8 from the two cases analyzed (81 and 151). X-axis indicates log2 ratio of tumor/normal intensities. Positive values (to the right) indicate hypomethylations, negative values (to the left) indicate hypermethylations. Additional examples are shown in Supplementary Figure 5.

