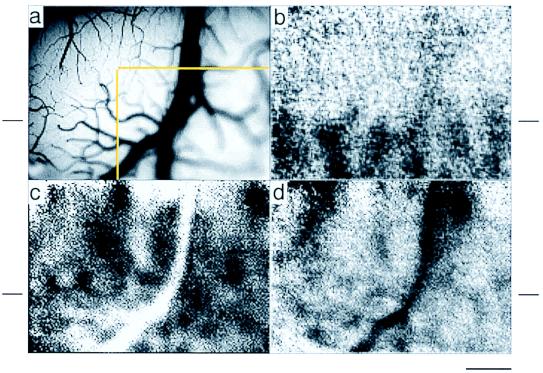
Figure 1.
Optical imaging of functional organization in the visual cortex of the anesthetized monkey. Synchronization to respiratory or cardiac cycles was not used. Sum of 20 trials. (a) Blood vessel map of imaged area of visual cortex. Yellow outline indicates part of region shown in Fig. 2. (b) Ocular dominance map revealing alternating left eye (dark) and right eye (light) ocular dominance columns in V1. This map delineates the sharp border between V1 and V2 (indicated by short horizontal line beside each panel). (c) Orientation map generated by subtracting images acquired during presentation of drifting horizontal gratings (dark patches) from those acquired during presentation of drifting vertical gratings (light patches). As previously shown (2, 11, 13), small orientation domains (100–200 μm) are mapped in V1, while those in V2 are significantly larger and overlay the thick and pale stripes. (d) General activation map, obtained in response to binocular presentation of low spatial frequency stimuli, reveals thick and thin stripes in V2. (Scale bar = 1 mm.)

