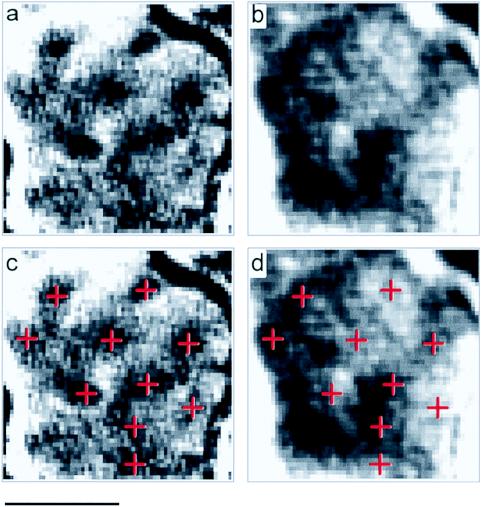
Figure 3.
Optical imaging of blob domains in V1 of the awake, trained monkey. (a) A monocular (dark) vs. binocular (light) subtraction revealing punctate regions of activation, measuring 100–200 μm in size. Sum of two trials. (b) Ocular dominance bands (diagonally oriented alternating dark and light bands) in V1 demonstrated by mapping activation through left eye (dark regions). (c) Blob locations are indicated by crosses. Sum of two trials. (d) Crosses align along centers of ocular dominance bands. (Scale bar = 1 mm.)

