Figure 4.
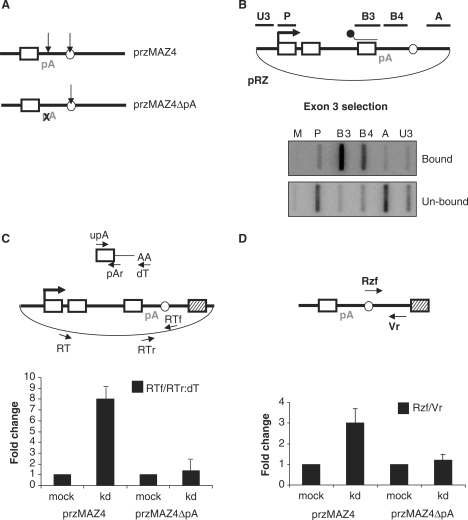
hPcf11 function requires a functional pA signal. (A) Diagram of przMAZ4 and przMAZ4ΔpA. Final exon (white box), pA site (pA), RZ (white circle) and MAZ4 element (hatched box) are shown. pA site mutation is denoted by an X. Arrows represent sites of transcript cleavage. (B) hsNRO analysis of pRZ (shown in diagram). Transcripts were selected with the B3 probe (shown in the diagram above the final exon). Top panel shows selected transcripts (bound) and the bottom panel shows unselected transcripts (un-bound). NRO probes are shown in the diagram. (C) Real-time RT-PCR analysis of transcriptional termination on przMAZ4 or przMAZ4ΔpA in mock-treated or hPcf11-depleted (kd) cells. The plasmid is przMAZ4, where the RZ is shown by a white circle. The primers used for reverse transcription (RT) and PCR (RTf/RTr) are shown. The top diagram depicts the 3′ end of the mRNA (from the final exon to the poly(A) tail). Primers used for reverse transcription (oligo-dT) and PCR (upA/pAr) are indicated. Read-through was calculated as a ratio of the two PCR products and set at 1 in mock-treated cells. (D) Real-time RT-PCR analysis of the 3′ RZ cleavage product in mock-treated and hPcf11-depleted (kd) cells. Primers used for cDNA synthesis (Vr) and subsequent PCR (Rzf/Vr) are shown in the diagram. The RZ is again depicted by a white circle. Graph shows fold change where the value for mock-treated cells is given a value of 1.

