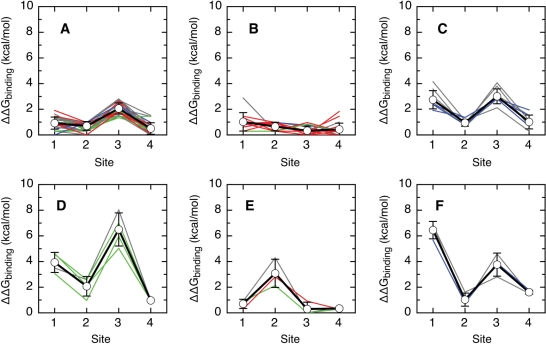
Figure 5.
Six classes of relative binding affinity hierarchies for the E2–DNA interaction. For each group of types, we represent the average relative predicted affinity and standard deviation for each site (thick black line, points) and the values for each type (high-risk types in red, low-risk types in green, cutaneous types in blue and other types in grey). The types were grouped using the k-means algorithm (see Methods section). The binding energy of the consensus target sequence was arbitrarily set to zero. All other sequences have positive predicted values of ΔΔGbinding, indicative of a reduced predicted binding affinity. (A) High-risk types 16, 35, 52, 53, 56, 66 and 73; low-risk types 6b, 40, 42, 43 and 44; cutaneous types 2, 2a, 2isoC2, 27 and 27b; and types 13, 13b, 30, 34, 35H, 55, 57, 57b, 67, 71, 74subtype, 90cand, 91, 106, PCPV1 and RHPV1. (B) High-risk types 18, 26, 33, 39, 45, 51, 58, 59, 68a, 82 and 82subtype; low-risk types 6, 6a, 11 and 54; cutaneous type 7; and types 32, 85cand, 97 and 97iso624. (C) Cutaneous types 3, 10, 28, 29 and 94; and types 84, 86cand, 87cand and 89cand. (D) Low-risk types 61, 72 and 81; and type 62cand. (E) High-risk type 31; low-risk type 70; and type 69. (F) Cutaneous type 77; and types 83 and 102.

