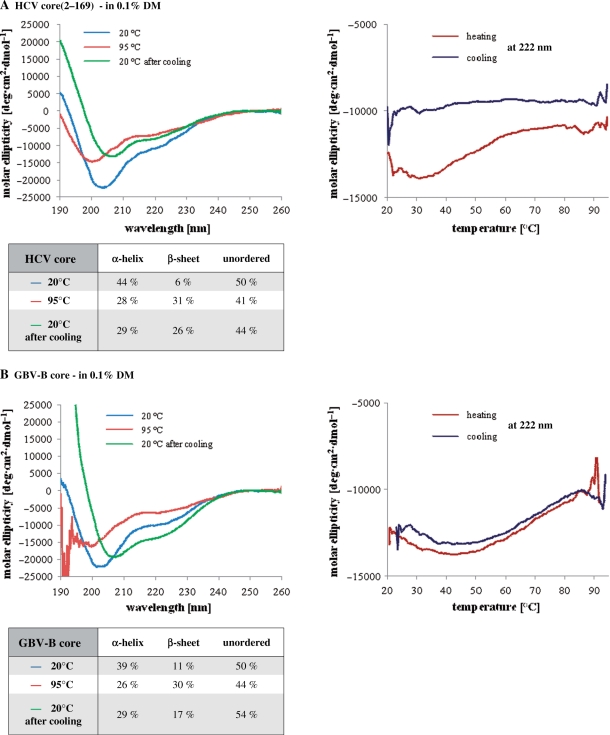
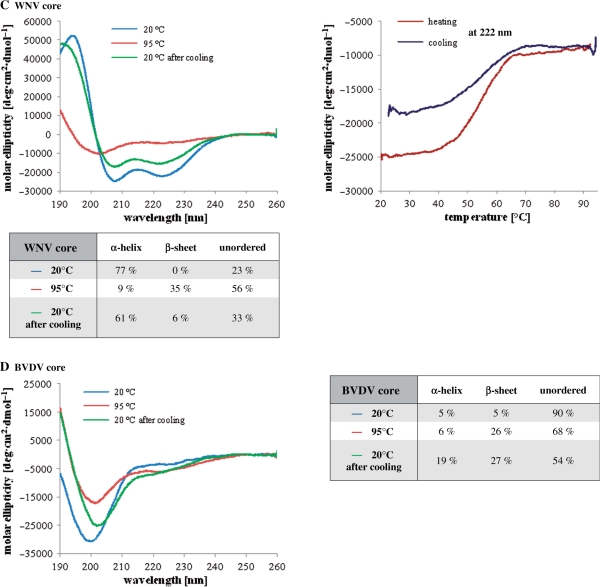
Figure 6.
Far-UV CD analysis of core proteins. Far-UV CD spectra of HCV (A), GBV-B (B), WNV (C) and BVDV (D) core proteins. Measurements were done in 20 mM sodium phosphate buffer (pH 7.4) containing 5 mM 2-mercaptoethanol. For HCV and GBV-B core proteins, the buffer also contained 0.1% n-dodecyl β-d-maltoside (DM). Spectra were recorded at 20°C, at 95°C after slow heating of the protein, and again at 20°C after slow cooling. Melting curves were recorded at 222 nm, during the heating and cooling processes. Secondary structure content was calculated by the k2d method of spectral deconvolution (http://www.cryst.bbk.ac.uk/cdweb/html/home.html).


