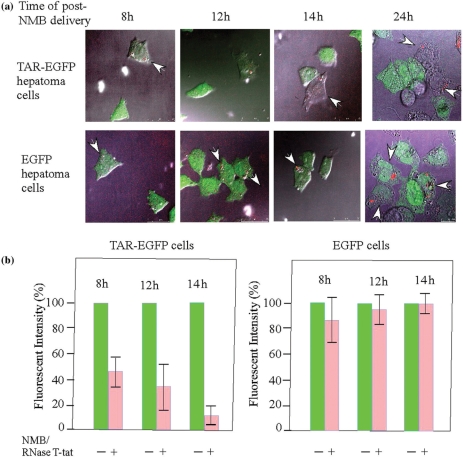
Figure 5.
The suppression of the expression of TAR-carrying EGFP by RNase T-tat as detected at single cell level. (a) The observations of the suppression of the expression of EGFP (shown in green) by internalized NMB (red) that carried RNase T-tat gene measured at different time intervals post-NMB delivery. The presenting photos are the merged images derived from results of phase contrast microscopic and fluorescent microscopic examination. Arrows showed cells that have impregnated with NMB(s). (b) The quantification of the effects of RNase T-tat as measured by the fluorescent intensity. The fluorescent intensity in a cell that contains no NMB was used as a 100% control for EGFP expression. Each bar represents an average measurement of 10 or more cells.

