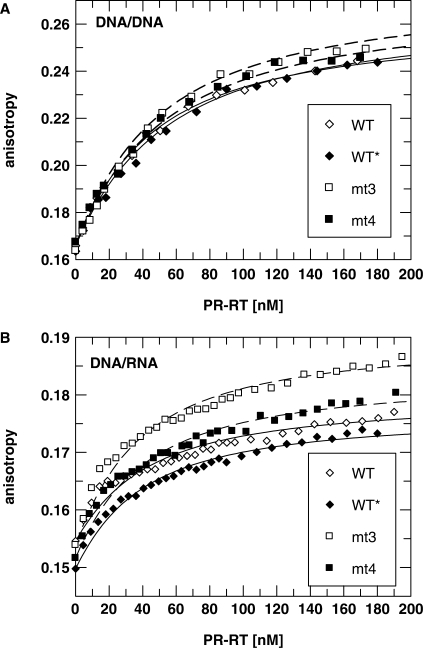
Figure 1.
Determination of KD-values by fluorescence anisotropy measurements. Fifteen nanomolar of a fluorescently labeled DNA/DNA (A) or DNA/RNA (B) P/T substrate was titrated with different PR–RTs at 25°C. The curves show the best fit to Equation (3) (‘Materials and methods’ section) describing the binding equilibrium with KD-values shown in Table 2.

