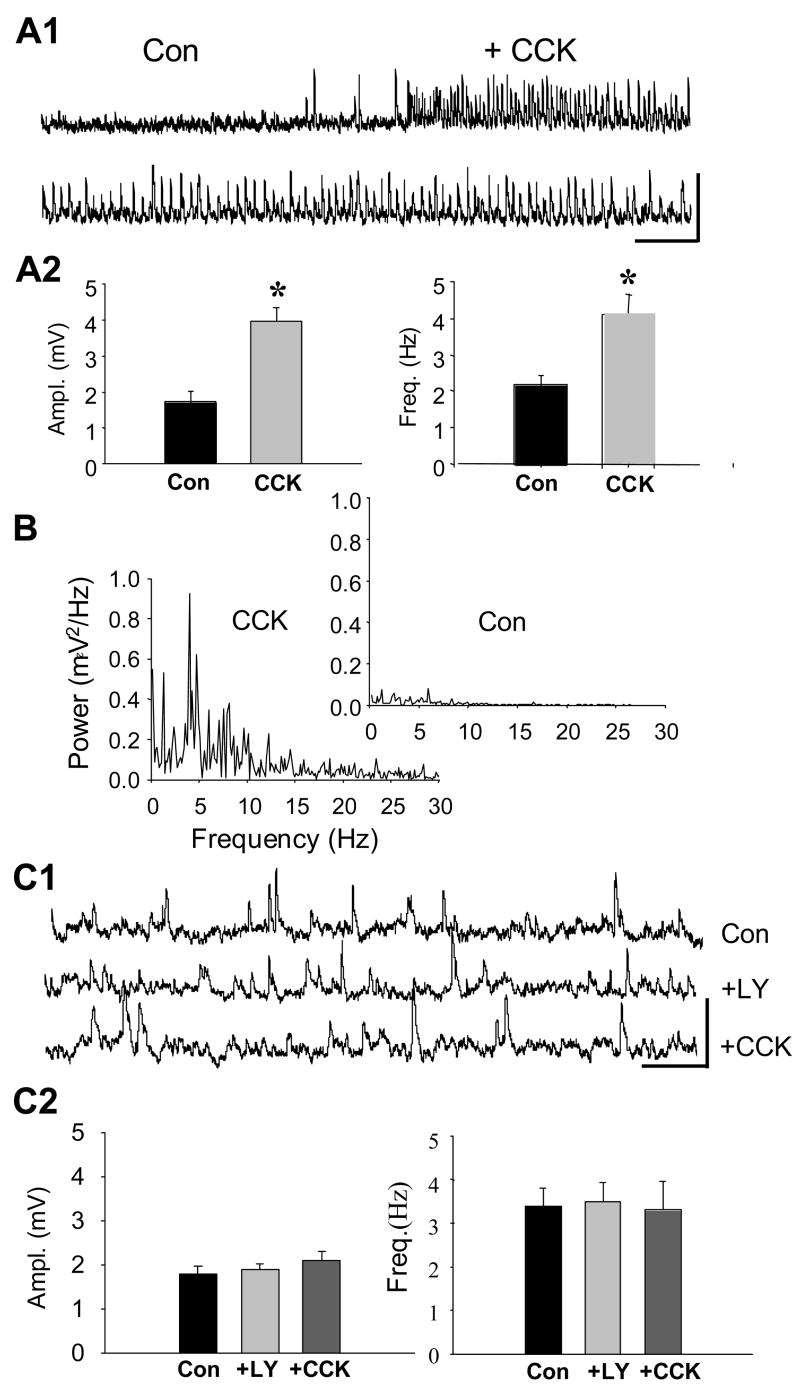
Figure 1. CCK receptor agonist enhances sIPSP activity (CCK-sIPSPs) in CA1 pyramidal cells.
Recordings are shown for the same cells before and during the experimental treatment, unless otherwise stated. A1), Upper - representative trace of sIPSPs before (Con) and during wash-in of 1 μM CCK8-S. Lower - representative trace of CCK-sIPSPs in same cell. Calib. =10 mV, 2 sec. A2) Group data (n = 8 cells, 10-sec traces from each cell) showing that CCK8-S increased sIPSP amplitudes and frequencies (paired-t tests). B) sIPSP spectral power in the ‘theta’ frequency range (4–14 Hz) is enhanced by CCK8-S (control spectrum in inset). Graphs represent data from one cell, and are representative of spectra from all 16 cells. C1) Traces (same cell throughout) showing sIPSPs in control solution (upper trace), 15 min after addition of the CCK2-selective antagonist, LY225910 (2 μM), to the solution (middle trace), and 20 min after adding CCK8-S to the solution (lower trace). Calib. = 5mV, 1 sec. Note LY225910 does not affect control sIPSPs, but prevents increase in sIPSPs by CCK8-S. C2) Group data (n = 9, same cells in all conditions).

