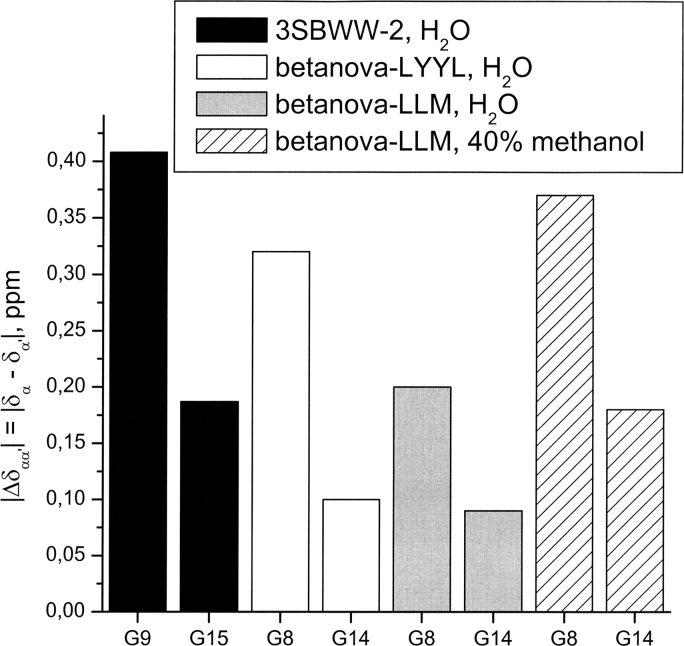
Figure 9.
Histogram showing the splitting of CαH and Cα′H protons (ΔδGly = δCαH − δCα′H, ppm) for G9 and G15 residues in peptide 3SBWW-2 in H2O/D2O 9:1 (v/v) at pH 5.5 and 10°C (filled bars) and for G8 and G14 in Betanova-LYYL (open bars), Betanova-LLM (López de la Paz et al. 2001) in aqueous solution (gray bars), and in 40% methanol (striped bars).

