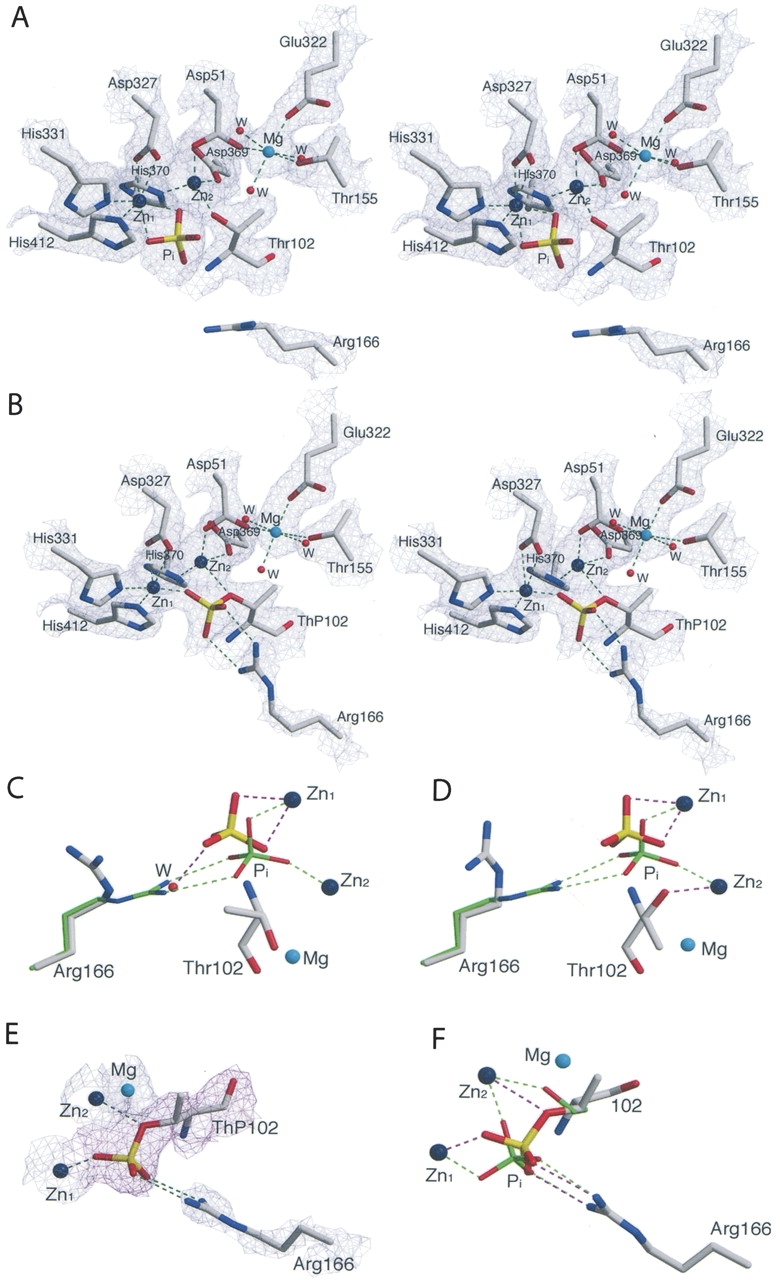
Figure 1.

(A) Stereoview of the active site of the S102T_Pi structure. Shown is the 2F o –F c electron density map for the A chain (1.2 σ). The side chain of the Thr102 are in the χ = −60° conformation). Water molecules are shown as red spheres and zinc and magnesium atoms as large dark blue and cyan spheres. Dashed lines represent hydrogen bonds. (B) Stereoview of the 2F o –F c electron density map for the B chain of S102T_sub (1.2 σ). (C) Comparison of Arg166 and Pi in the active sites of the S102T_Pi structure (elemental colors, thick lines) and the WT_Pi structure (PDB code 1ED8; Stec et al. 2000; green, thin) in the A chain and in the B chain (D). Ligands around the metals are not shown. (E) Active site of the S102T_sub structure. The Arg166 and metals are overlaid on the 2F o –F c electron density map (blue) shown contoured at 1.2 σ. The ThP102 is overlaid on the F o –F c electron density map (magenta) shown contoured at 1.5 σ. (F) Comparison of Pi and Ser102 (ThP102) in the active site of the S102T_sub structure (elemental colors, thick lines) and the WT_Pi (green, thin) structure. Ligands around the metals are not shown. Figures were prepared using MOLSCRIPT (Kraulis 1991).
