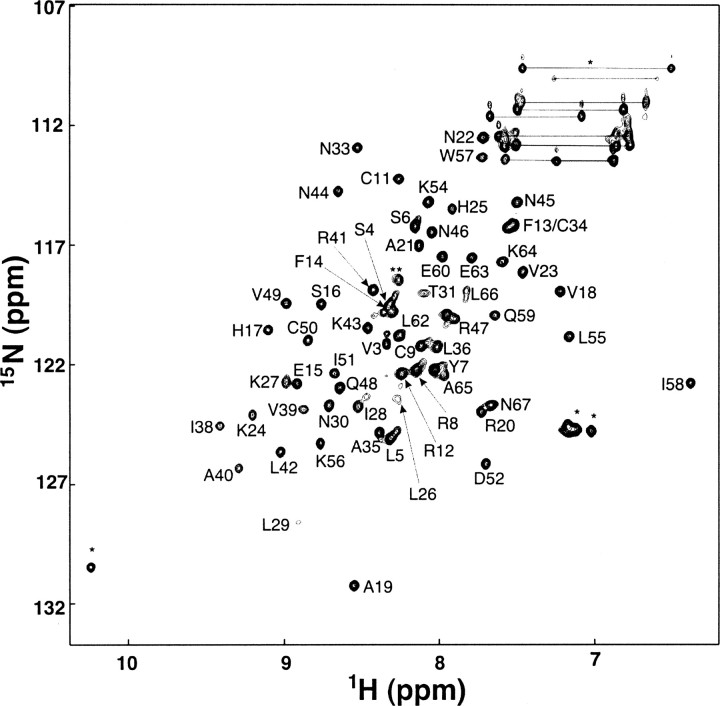
Figure 1.
2D 1H–15N HSQC correlation spectrum of 1.5 mM SDF-1α. Assigned residues are indicated on the spectrum with labels. Arginine and glutamate side chain amide protons as well as the indole NH of Trp57 are indicated with an asterisk. The resonance marked with a double asterisk was not assigned.

