
Figure 2.
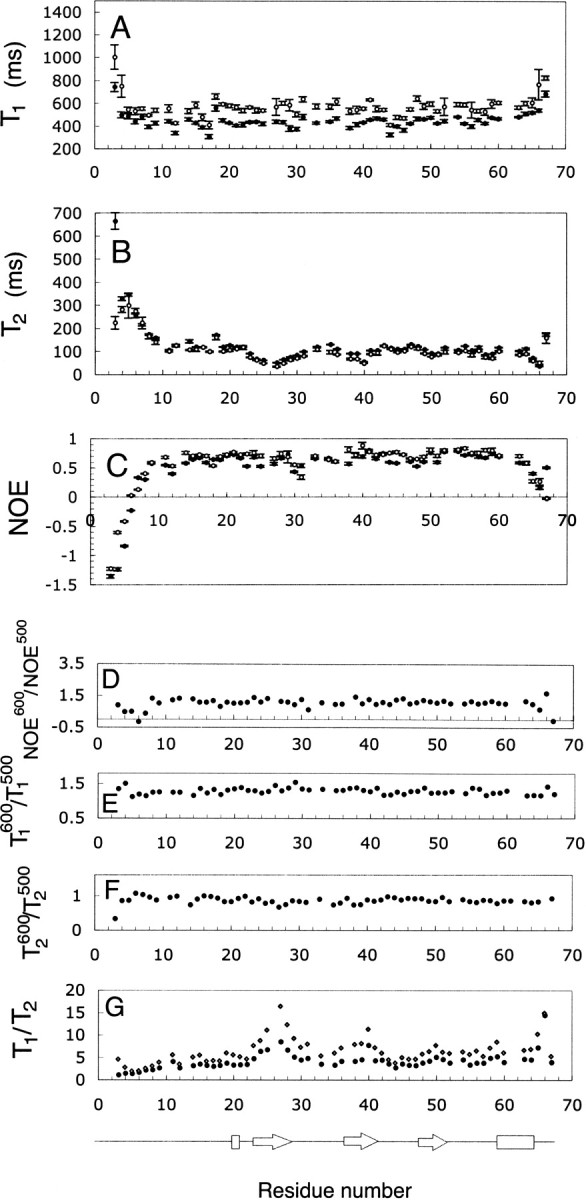
(A–G) Relaxation data obtained at two magnetic fields for 1.5 mM SDF-1α. (A) T1600 (○) and T1500 (•); (B) T2600 (○) and T2500(•); (C) NOE600 (○) and NOE500 (•); (D) NOE600/NOE500 ratio; (E) T1600/T1500 ratio; (F) T2600/T2500 ratio; and (G) T1600/T2600 ratio ( ) and T1500/T2500 ratio (•). Elements of secondary structure were determined from the coordinates of the crystal structure (Dealwis et al. 1998).