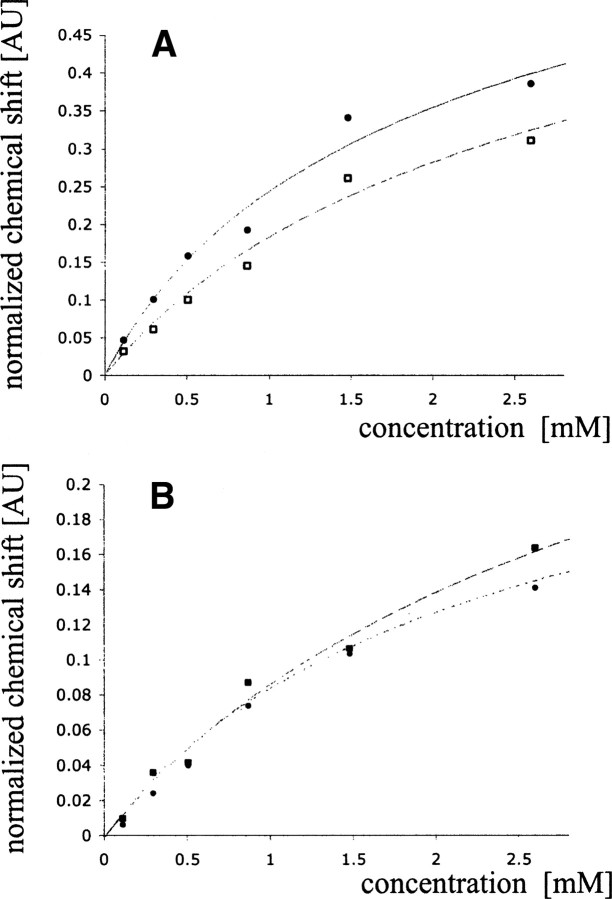
Figure 5.
Chemical shift changes obtained using 1D 1H and 2D 1H–15N NMR spectroscopy plotted as a function of SDF-1α concentration. (A) Normalized proton chemical shift changes determined using 1D NMR spectroscopy as a function of SDF-1α concentration for 3,5H of Tyr7 (•) and 2,6H of Phe14 (□). (B) Normalized proton chemical shift changes determined using 2D 1H–15N NMR spectroscopy as a function of SDF-1α concentration for Val39 (▪) and Trp57 (•).

