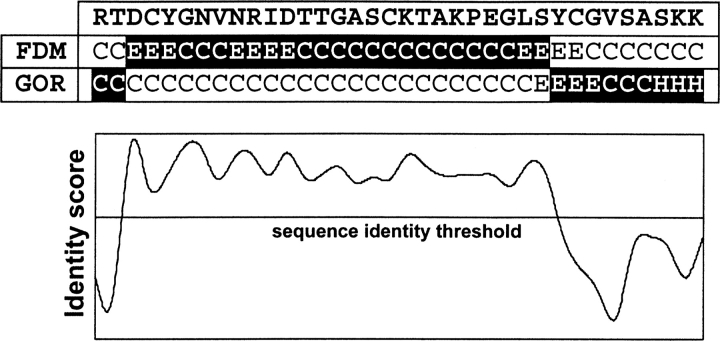
Figure 1.
The graphical representation of the CDM method. For a given sequence fragment, the FDM and GOR V three-state predictions are calculated. Then, according to a sequence identity threshold (shown as a straight horizontal line), the regions with higher identity scores (above the line) predicted by FDM are selected, and the rest by GOR V. The final predictions are highlighted in black background.

