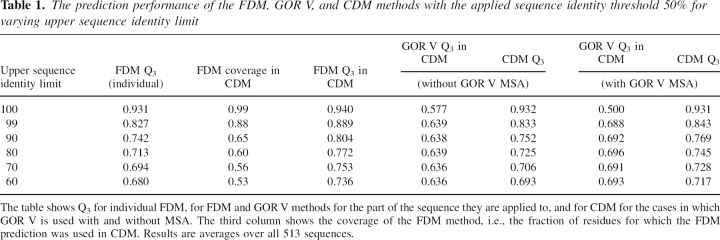
Table 1.
The prediction performance of the FDM, GOR V, and CDM methods with the applied sequence identity threshold 50% for varying upper sequence identity limit
The table shows Q3 for individual FDM, for FDM and GOR V methods for the part of the sequence they are applied to, and for CDM for the cases in which GOR V is used with and without MSA. The third column shows the coverage of the FDM method, i.e., the fraction of residues for which the FDM prediction was used in CDM. Results are averages over all 513 sequences.

