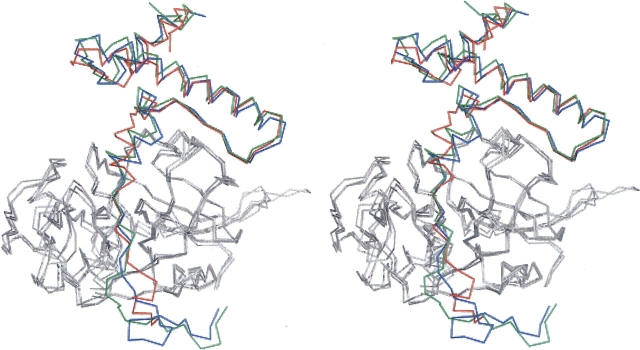
Figure 2.
Superposition of the Cα tracing of procathepsin S (red), K (blue), and L (green), as taken from PDB entries 2C0Y, 1BY8, and 1CS8, respectively. Only the prosequences are drawn in colors, the catalytic units are gray. The superposition underlines the high similarity for procathepsin S with procathepsin K (RMSD 0.79 Å) and procathepsin L (RMSD 0.88 Å). Stereo picture prepared with PyMOL (DeLano 2002).

